Energy calculation and optimisation based on annual, 8,760-hour data.
SiteEnergy models what actually happens between your solar array, battery and the grid — hour by hour, from your measured load curve — then finds which investment package genuinely pays for itself.
From 1 September 2026 · AI integration
Connect your own AI subscription to SiteEnergy
Analyse your energy data and build advanced reports with your own Claude, Perplexity or ChatGPT subscription — securely, read-only, on your own data. Part of the Complex plan.
Conversational analysis
Ask about any site's consumption, costs or anomalies — the AI answers from your own data.
Automatic report draft
The energy-audit and reporting data package in seconds — with expert sign-off before submission.
With your own subscription
No extra AI fee: the token cost is on your AI plan. One connection, many AIs.
Your data security
OAuth 2.1-based, read-only access; every customer reaches only their own data.
The problem
Spreadsheet sizing fails in three places
It works on monthly averages
The split between self-consumption and export is decided hour by hour. On monthly averages, solar and battery payback is routinely wrong.
It evaluates upgrades one at a time
A heat pump raises electricity demand, which solar then partly covers. Assessed separately, both numbers come out wrong.
Reporting is a separate job
Regulatory filings and ESG figures get assembled by hand afterwards — even though every input already sits in the calculation.
How it works
Three steps from data to decision
Load your data
Hourly or quarter-hourly consumption from Excel or CSV, inverter logs, meter readings. Weather and solar-yield data are fetched automatically from the site's coordinates.
Hourly calculation
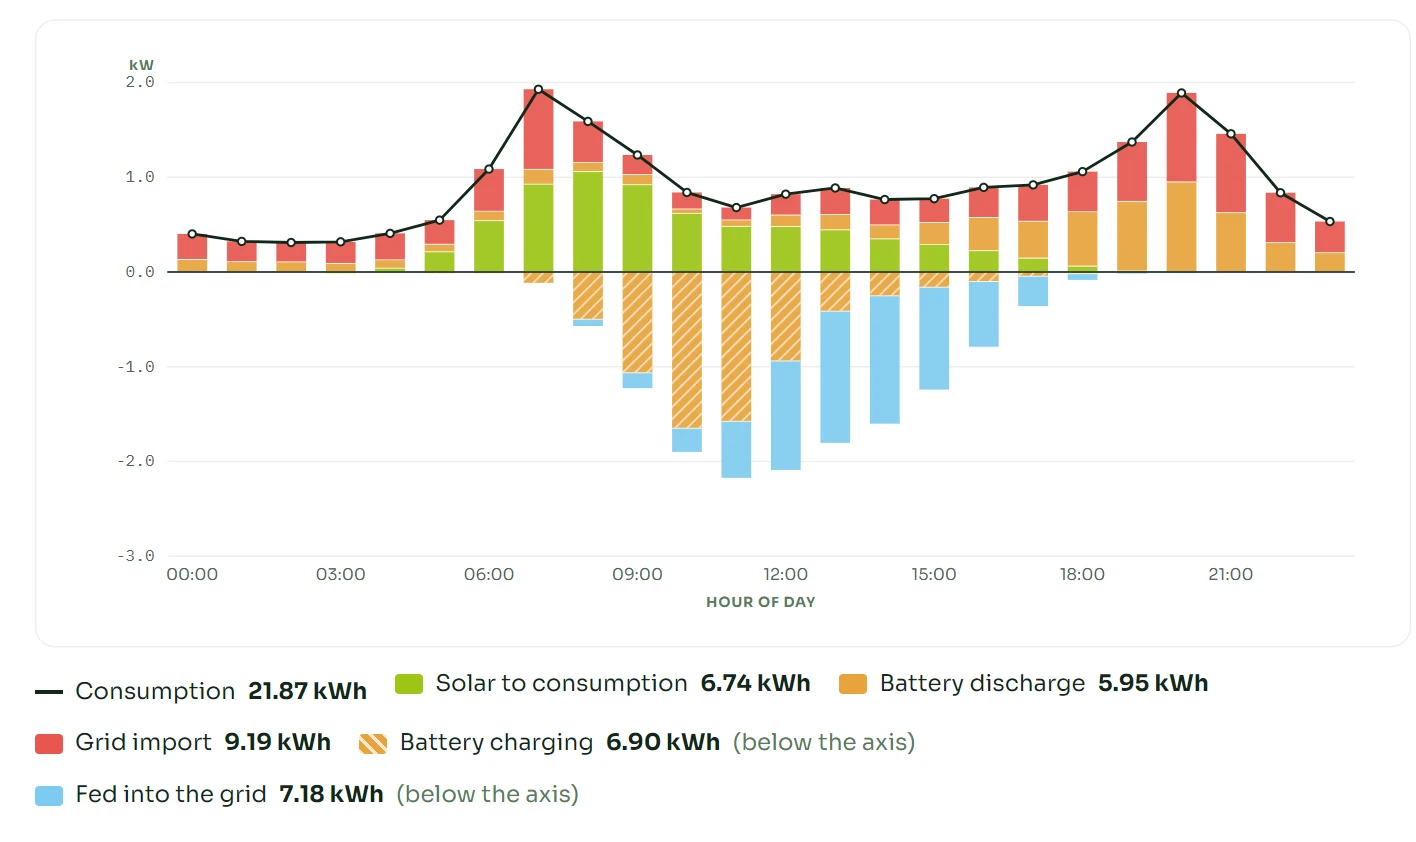
Every hour of a full year: how much goes to self-consumption, how much charges the battery, how much is exported — priced with your actual tariff.
Decide and report
The optimiser finds the best-returning package with NPV and IRR; the report module produces printable regulatory and ESG documentation.
Features
What the system does
Every module works from the same hourly dataset — no separate models, no manual transfer between tools.
Hourly energy flows
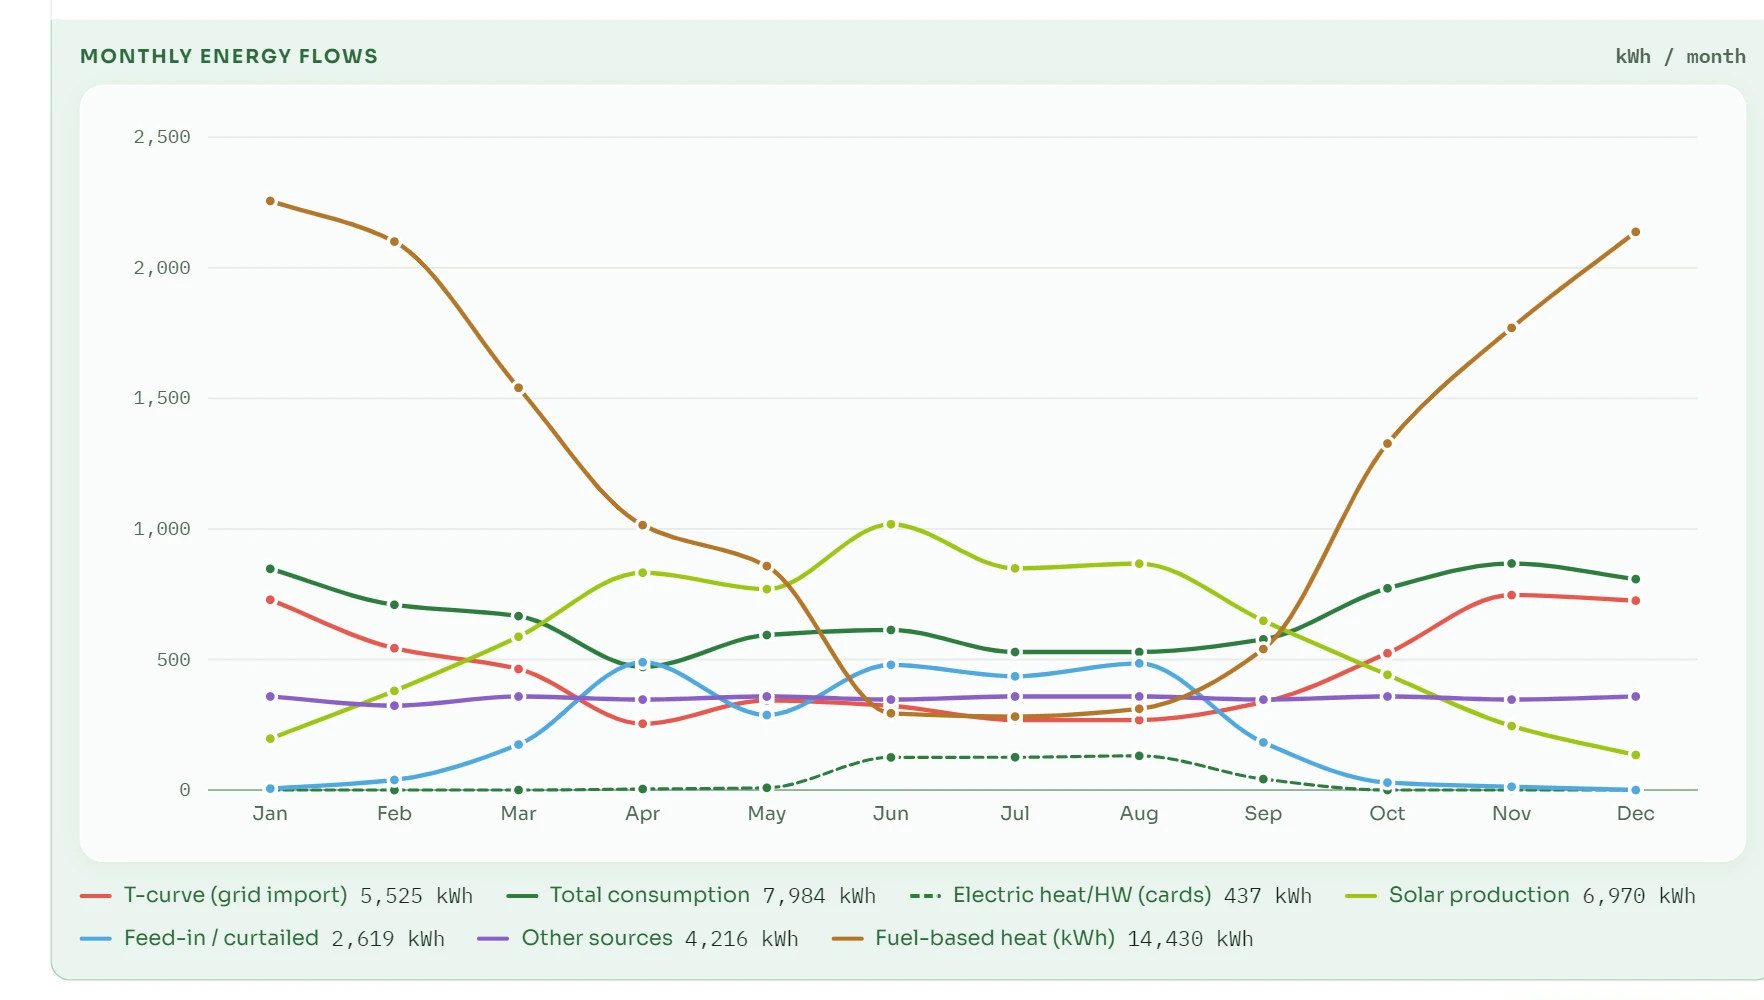
Reconstructs the flow between solar, battery and grid from your measured load curve — hour by hour, across a full year, with a monthly chart.
Investment optimisation
From 11 development types — solar, battery, heat pump, insulation, EV fleet, CHP and more — it finds the best combination, with payback, NPV and IRR.
Regulatory reporting
The Hungarian energy-officer annual report (Gov. Decree 122/2015) and the small-scale producer data sheet, filled from the calculation, ready to print.
Energy communities
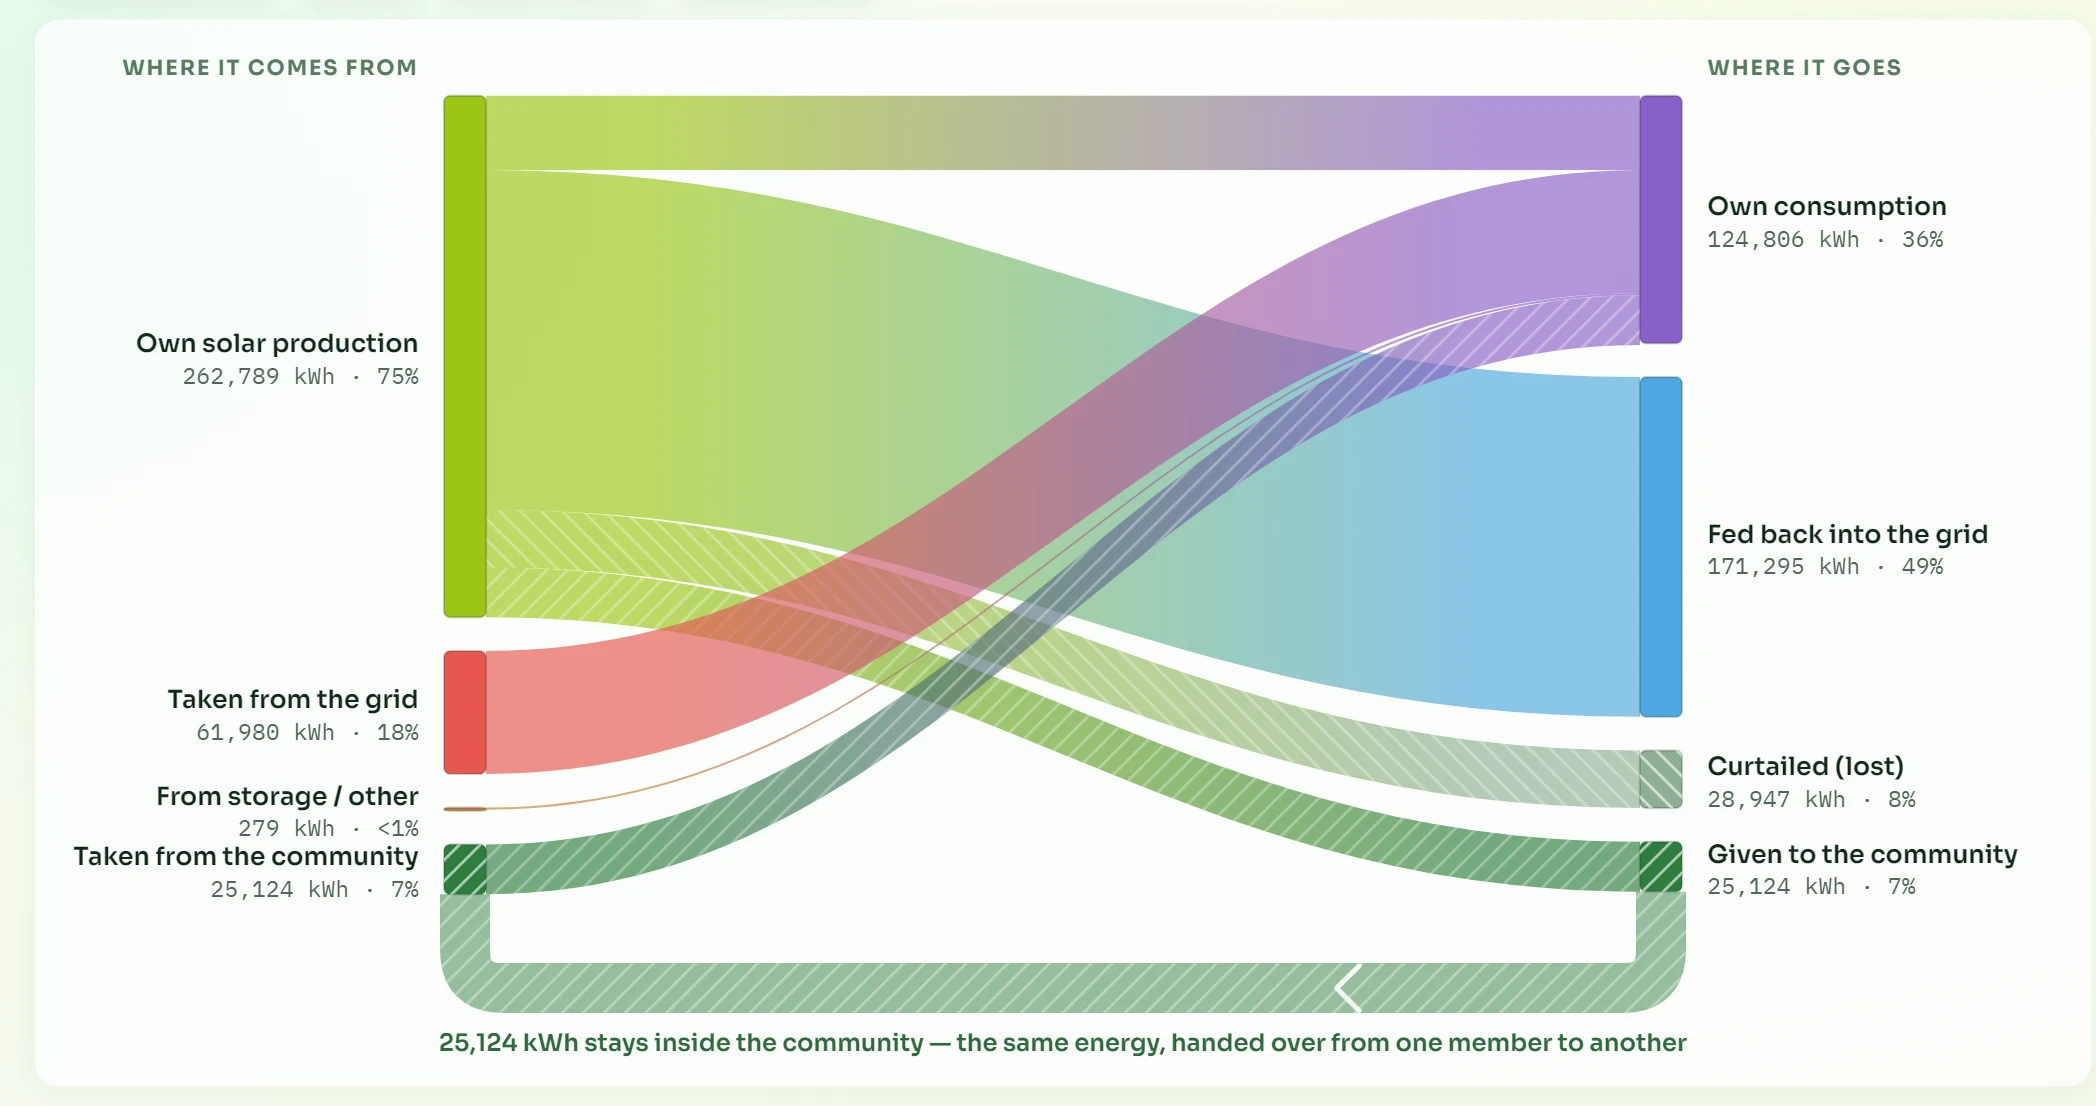
Links several sites hour by hour with rule-based settlement: how much energy can be shared, and what each member gains from it.
ESG and ISO 50001
Scope 1–2 accounting, energy performance indicators and target tracking — from the same data that drives the sizing.
Four languages, four markets
Hungarian, English, German and Polish interface, with the structure of 30 electricity tariffs from Hungarian, Polish, Austrian and German suppliers — Hungarian prices verified, the rest as reference values.
What it looks like
Not an illustration of the product — the product itself
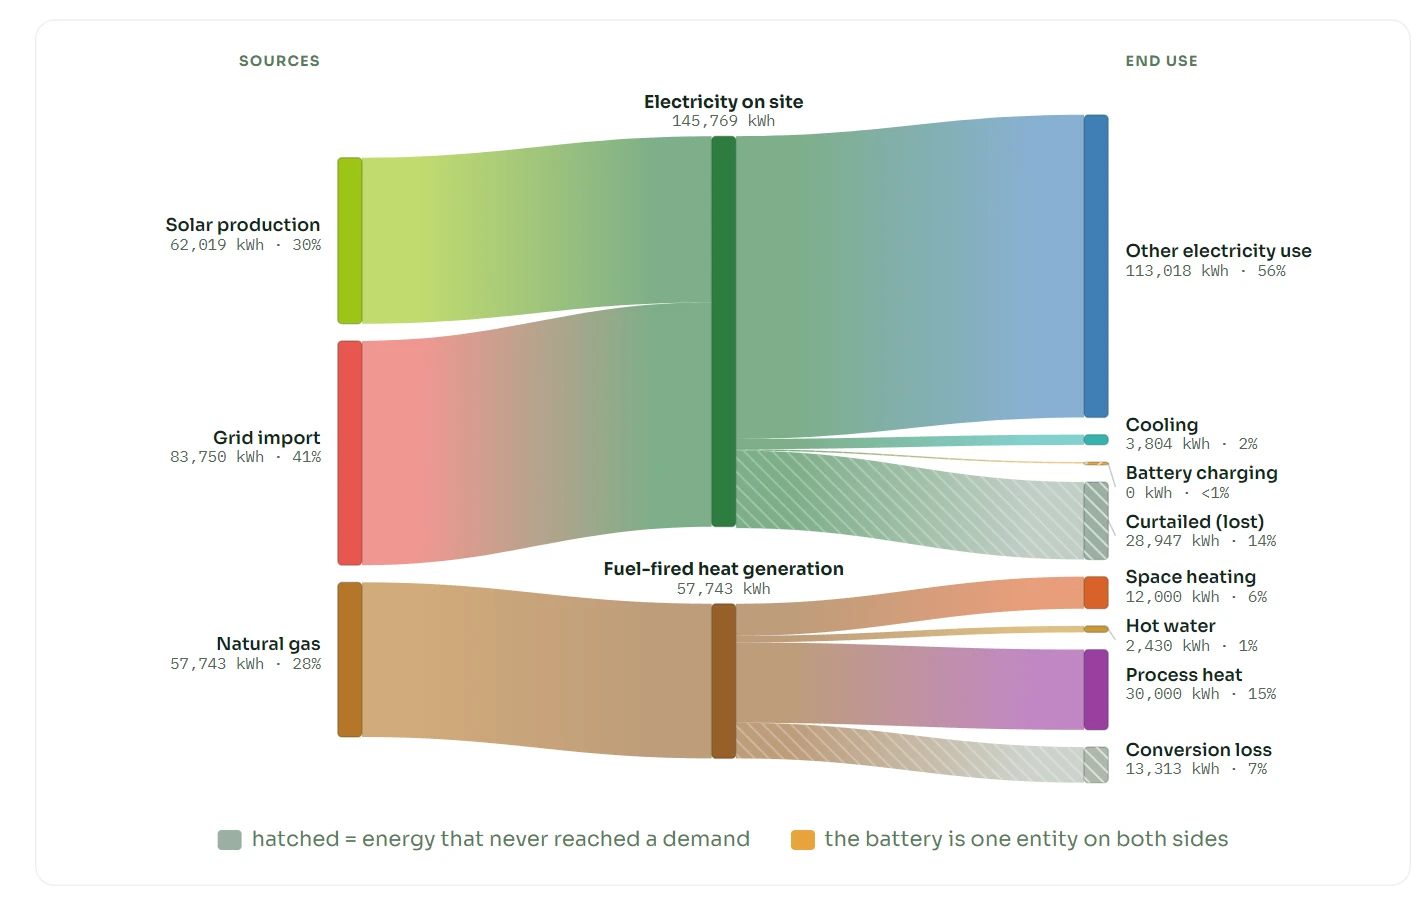
These are screenshots from the application, showing genuine results for real sites. Behind every figure sits a full year of hourly dispatch.
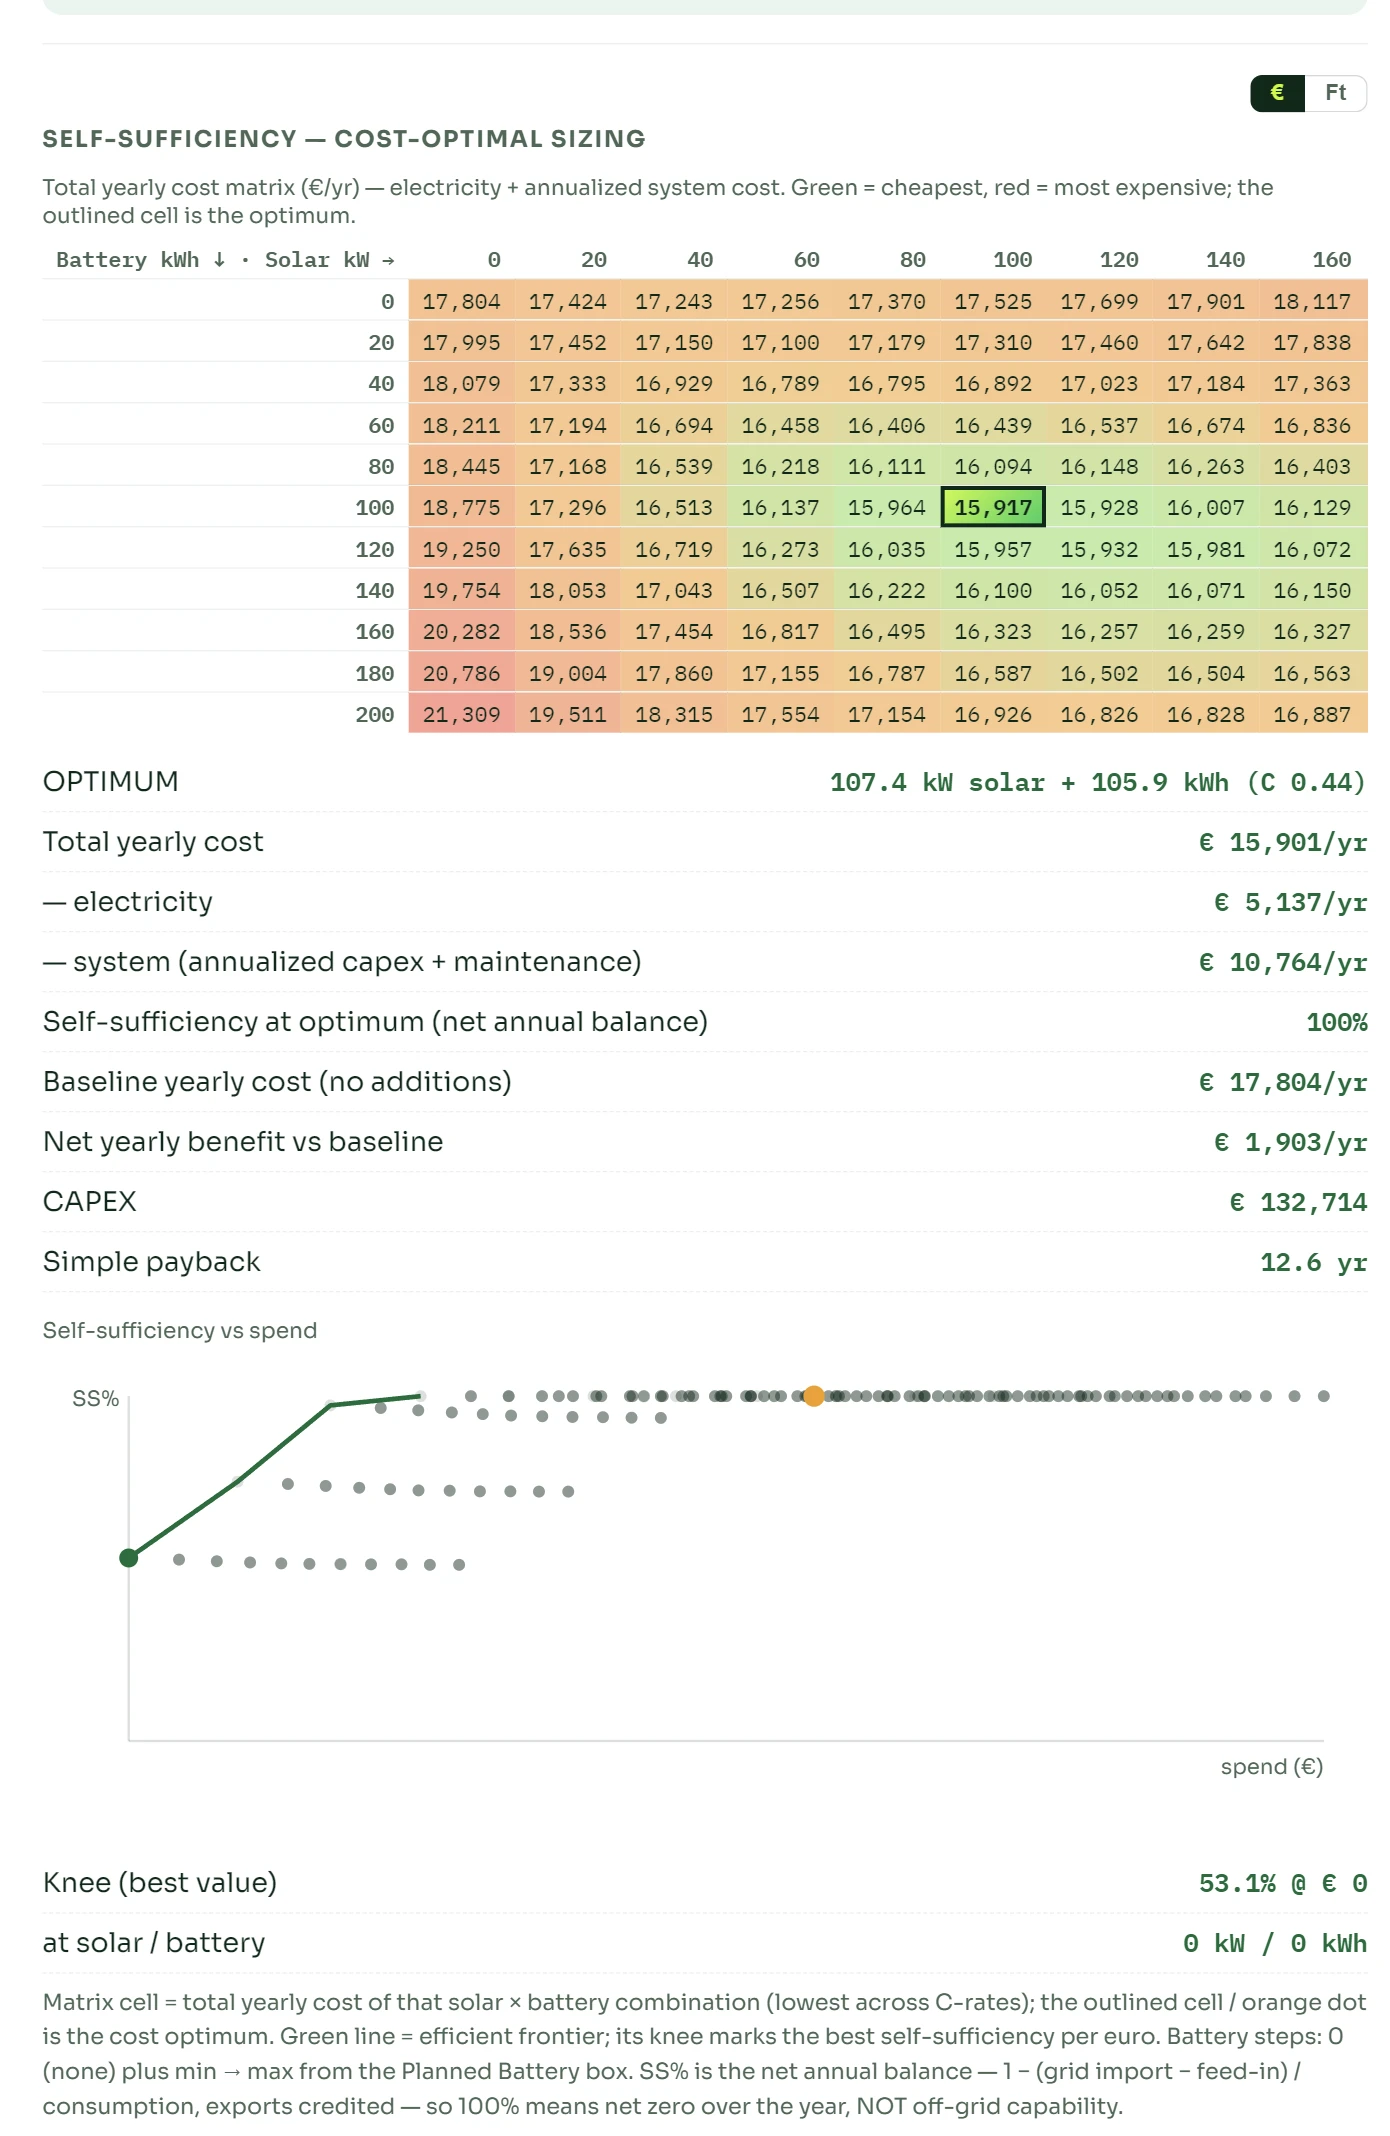
Optimiser — cost matrix
451 sizing combinations evaluated at an industrial site. The optimum is 107 kWp of solar plus 106 kWh of storage: €15,901/yr total cost instead of today's €17,804, a 12.6-year payback. The matrix also shows where the investment stops paying — every cell is a full year of hourly dispatch.
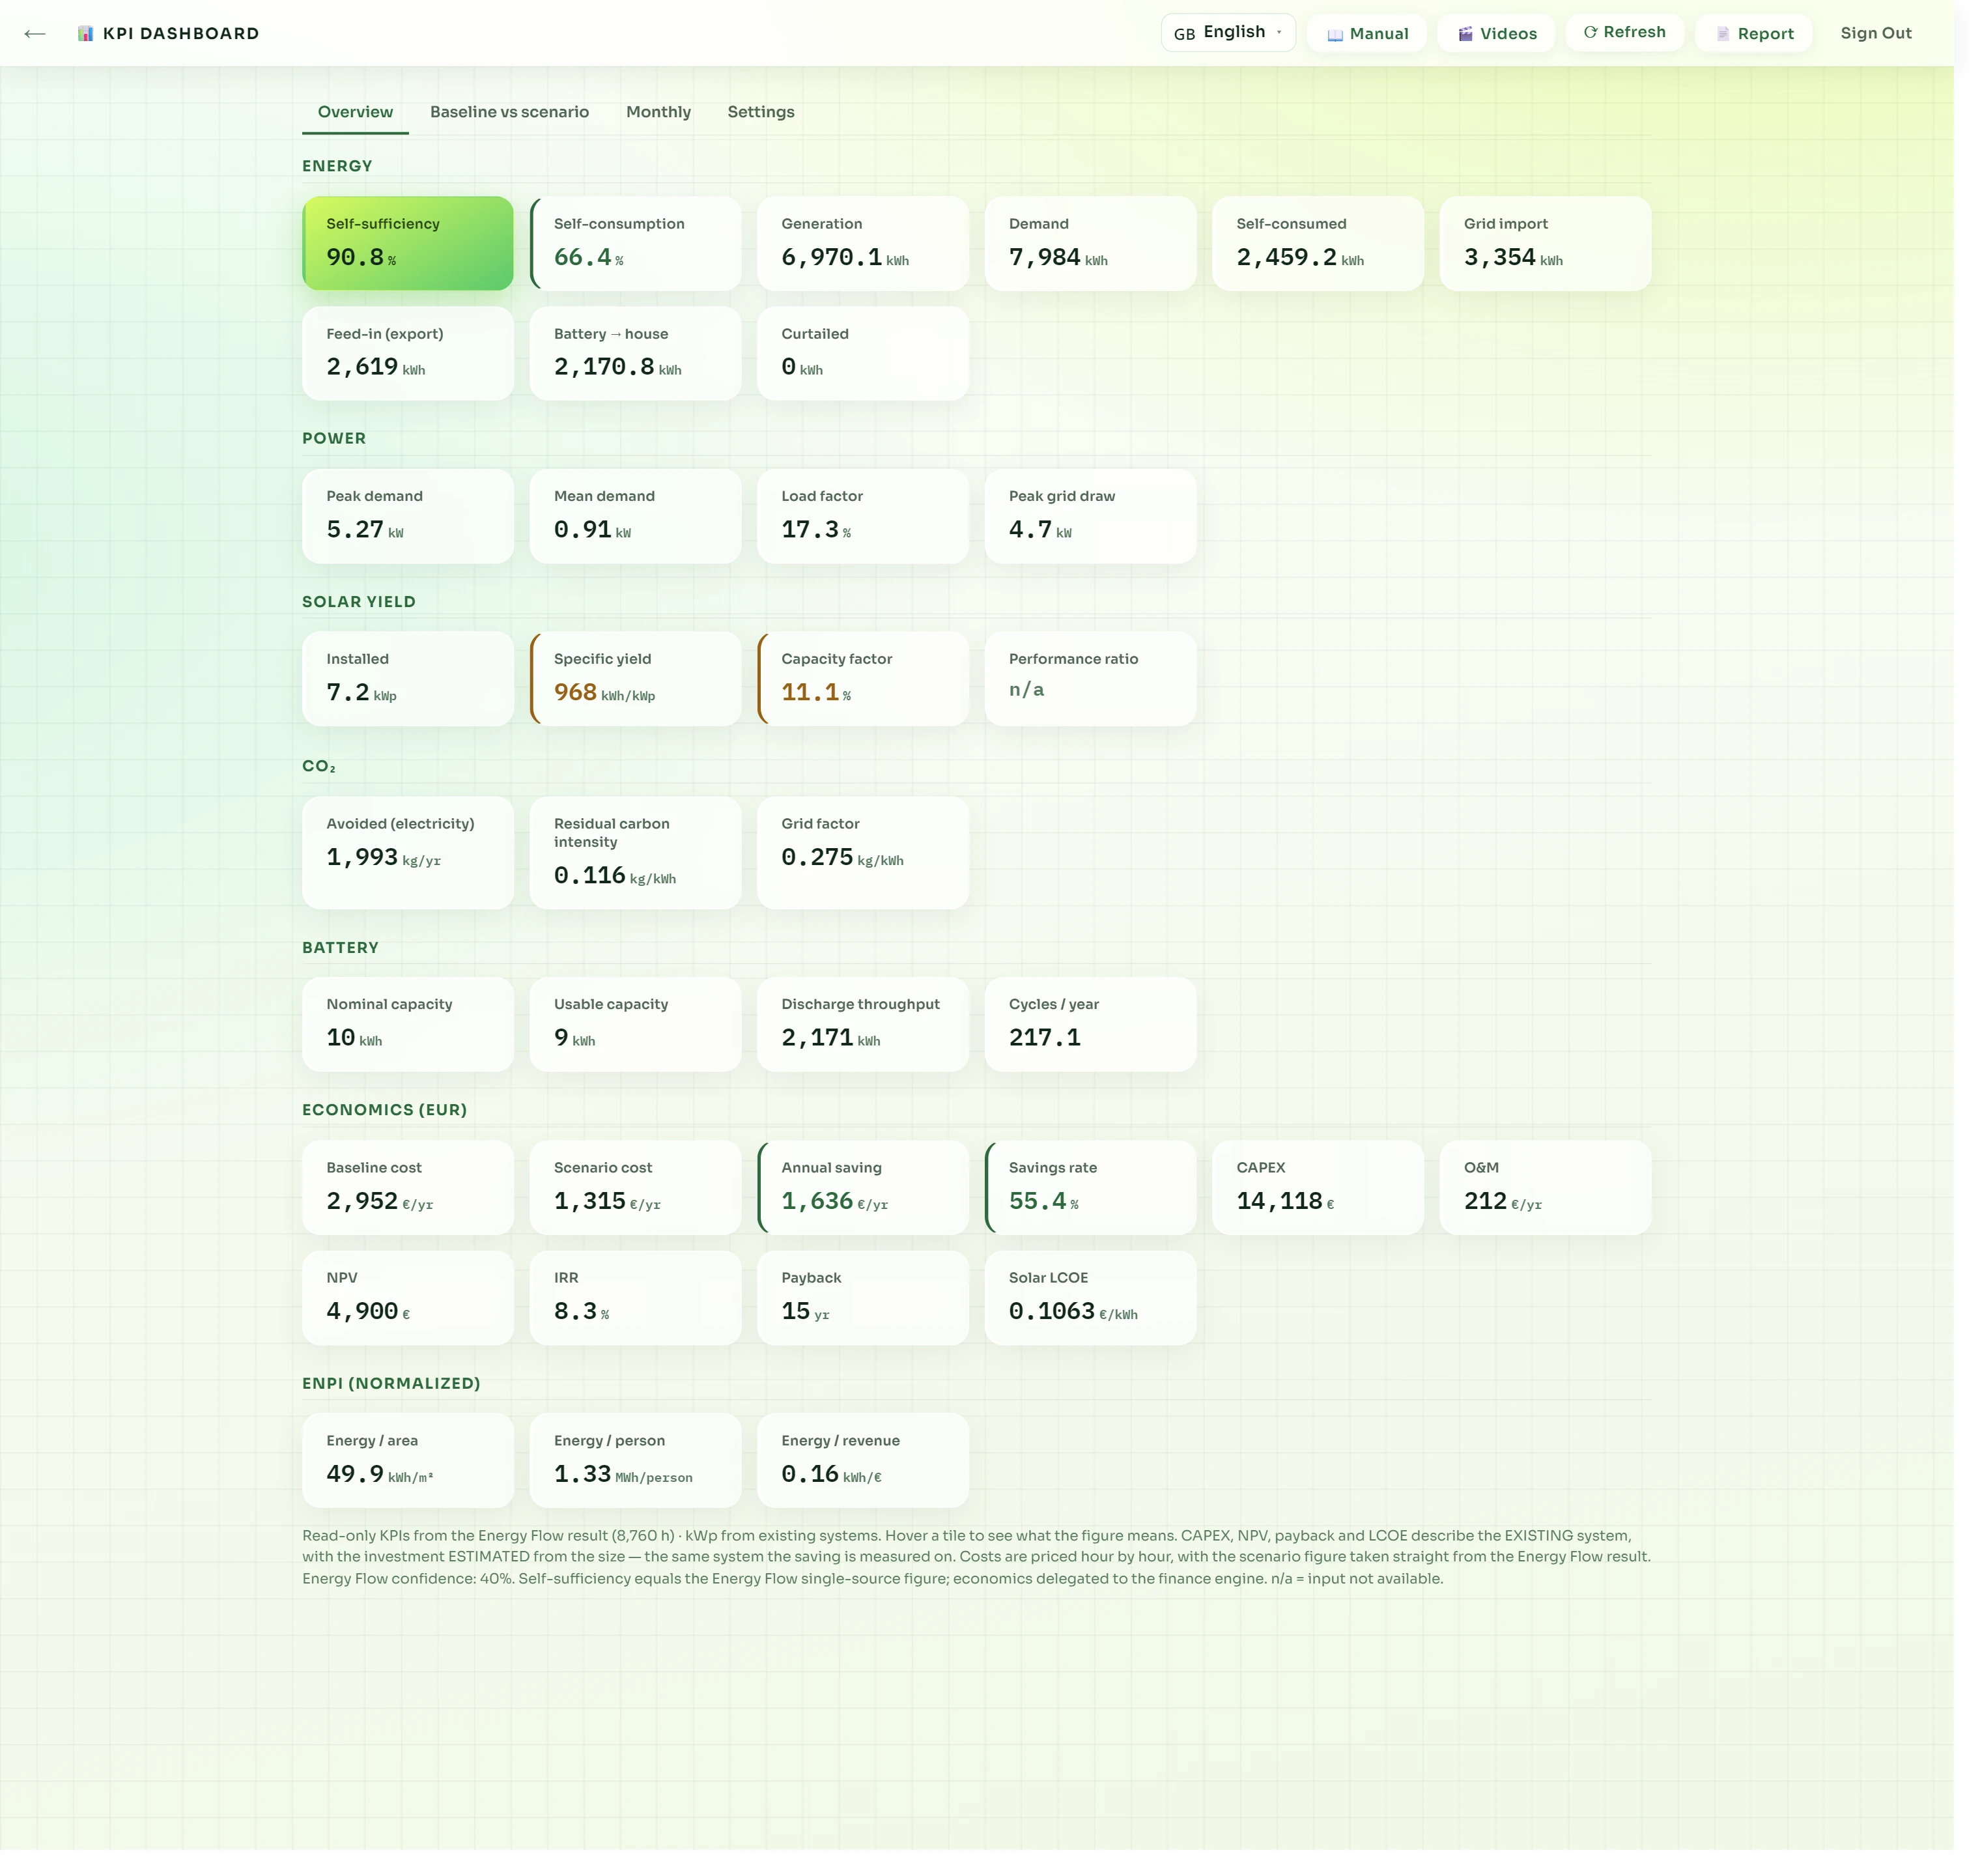
KPI dashboard
The result of the 8,760-hour calculation on one page: 90.8% self-sufficiency, 66.4% self-consumption, 5.27 kW peak demand, 1,993 kg of CO₂ avoided per year — and the economics: €1,636/yr saved (55.4%), 15-year payback, €0.1063/kWh solar LCOE.
The screenshots show fictional site names and addresses (Verőfény Model Home and Verőfény Logisztika Kft.) — we do not publish real client data. The underlying consumption, solar and weather data are real measurements, and every result was computed by the application's own engine at hourly resolution.
Who it's for
For people who have to stand behind the number
Energy consultants
Sizing you can defend in front of a client — hourly, with payback, not a rule of thumb copied from a table.
Solar installers
A printable analysis alongside the quote: what size is justified, and how long it takes to pay back.
Energy officers
Annual report chapters assembled from measured data, methodology footnotes included.
Industrial operators
Site comparison, energy breakdown by area, ESG accounting and community settlement in one place.
Plans
Three tiers, matched to the depth of your work
Two months free on annual billing. 30% founding discount for the first 10 customers. Full comparison and pricing →
Basic
For straightforward sizing
- Sites and load curves
- Solar and battery
- Hourly energy-flow calculation
- Investment optimisation
- Regulatory reporting
Advanced
For consulting work
- Everything in Basic
- Heat pump, insulation, EV
- Investment optimisation with payback
- System analysis report
- Regulatory and ESG reporting
Complex
Full access
- Everything in Advanced
- CHP, wind, hydrogen, thermal storage
- Regulatory annual report
- ESG and ISO 50001 module
- Energy communities
A 14-day free trial is available with no payment obligation — choose the "Trial" plan on the order form.
Frequently asked
Worth knowing
What data do I need to get started?
The essential input is a measured load curve: an hourly or quarter-hourly Excel or CSV file from your supplier or meter. Weather and solar-yield data are fetched automatically from the site's coordinates.
Does it need installing?
No. It runs in the browser — nothing to install or maintain.
Where is my data stored?
In a Hungarian data centre, within the EU. It is not transferred to third countries. Details are in the privacy notice.
Can I use it for regulatory filing?
Yes. The system follows the format of the Hungarian energy-officer annual report (Gov. Decree 122/2015) and assists with the small-scale producer data sheet. Responsibility for submission and content remains with the energy officer.
What happens to my data if I cancel?
Your data remains exportable for a grace period after cancellation, then it is deleted. The exact period is set out in the terms of service.
Will I get an invoice?
Yes — every payment is invoiced under Hungarian rules, with the required tax authority reporting.
Let's get started
After you order we send a pro-forma invoice payable by bank transfer; access is activated once we confirm the transfer has arrived. Want to try it first? Choose the 14-day free trial on the order form.