Features
One dataset that every calculation works from
At the centre of the system sits a single hourly table: measured consumption, weather, solar production and every computed demand, aligned to the same hours. Every module reads from it — no separate models, no manual transfer, and no two results that contradict each other.
1 · Data
What you load, and what the system fetches on its own
Load curve
Hourly or quarter-hourly data from Excel or CSV. The system detects the granularity, aggregates to hours, and copes with the quirks of real utility exports: headerless files, semicolon separators, comma decimals.
Inverter and meter logs
Inverter export logs, battery state-of-charge logs, discharge data and hourly prices. Each upload lands in its own column, and from then on the calculation uses the measured value rather than an estimate.
Weather and solar yield
Outdoor temperature, wind speed and hourly solar production are fetched automatically from a real measurement archive, based on the site's coordinates. Nothing to upload.
2 · Hourly energy flows
What actually happens, hour by hour
From the measured grid import the system reconstructs how much of the solar output went to self-consumption, how much charged the battery and how much was exported — across a full year, all 8,760 hours.
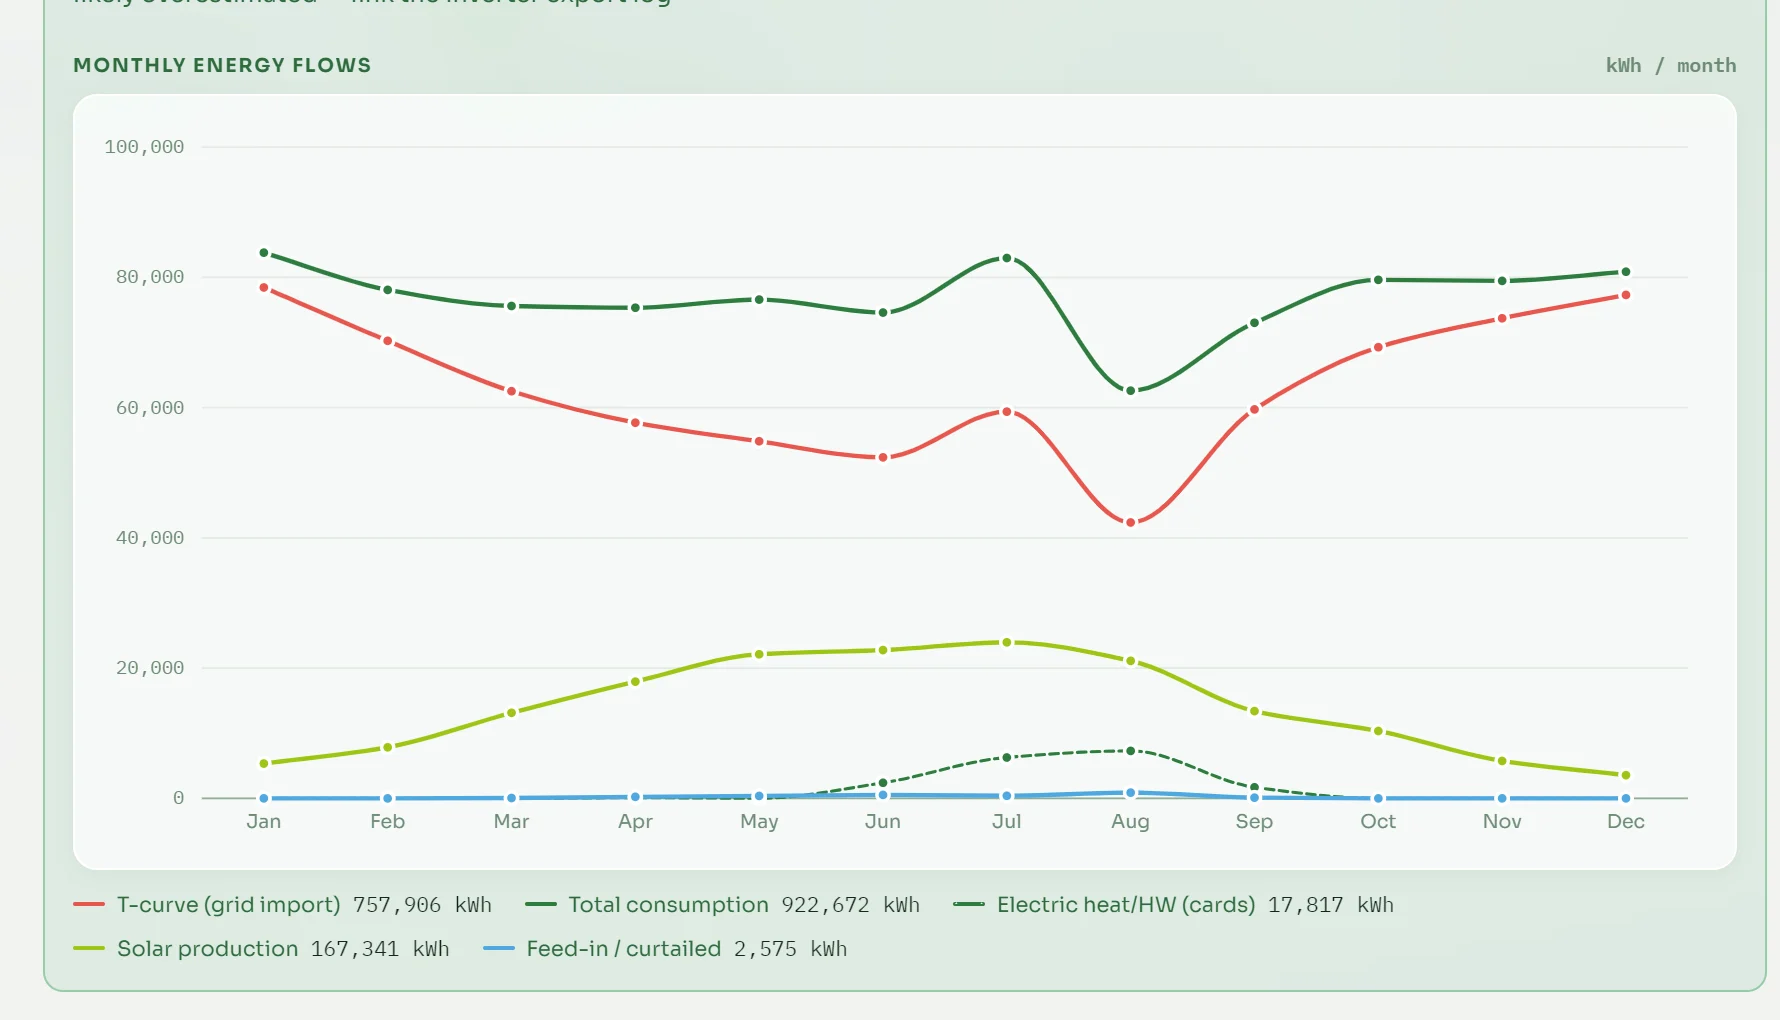
A full year for the demo site. The dip in August is a maintenance shutdown — visible at hourly resolution, invisible in a monthly average.
Battery simulation
If the battery did not exist during the measured year, the system simulates it in a separate pass: storing surplus, discharging at peak hours, and charging during cheap hours when the tariff varies.
Self-sufficiency on a net balance
The self-sufficiency figure credits exports — it shows how independent you are on an annual balance, not that you could run off-grid.
An honest confidence signal
The system states how much it relies on measurement and how much on modelling. Without export data it flags that self-consumption is an estimate — it does not pretend to know.
3 · Planned developments
Eleven development types, all evaluated hour by hour
Every saving comes from a full year of hourly dispatch — not from an annual average price multiplied by a guess. This is where the combined effect of a heat pump and solar shows up correctly.
☀️ Solar
Any size and orientation, with its own hourly evaluation.
🔋 Battery
Capacity and C-rate, with price arbitrage.
♨️ Heat pump
Temperature-dependent COP, linked to an existing demand.
🧱 Insulation
Heating and cooling demand reduction, hour by hour.
🚗 Electric vehicles
Residential and corporate fleet, smart charging and V2G.
⚙️ CHP
Simultaneous power and heat, with fuel accounting.
🌬️ Wind turbine
From measured wind speed, via a power curve.
💧 Hydrogen storage
Charge–discharge arbitrage on hourly prices.
🌡️ Solar thermal
Heat output distributed along the solar curve.
🔥 Flue-gas recovery
Displaced fuel and electricity.
🛢️ Thermal storage
Charging in cheap hours, discharging to the heat demand.
All of them
With NPV, IRR and discounted payback.
4 · Optimisation
It doesn't tell you what to buy — it tells you whether it pays
Five goals, five different questions
Backup capacity · peak shaving · income and NPV · cost-optimal self-sufficiency · and an NPV-based search across the whole package of developments.
A cost matrix, not a single number
For the self-sufficiency goal the system evaluates every combination of battery capacity and solar capacity, and shows in a colour-coded matrix where the real cost optimum lies.
It also tells you when it doesn't pay
For the demo site the optimum came out without a battery: every battery row in the matrix costs more. A sizing spreadsheet would never tell you that.
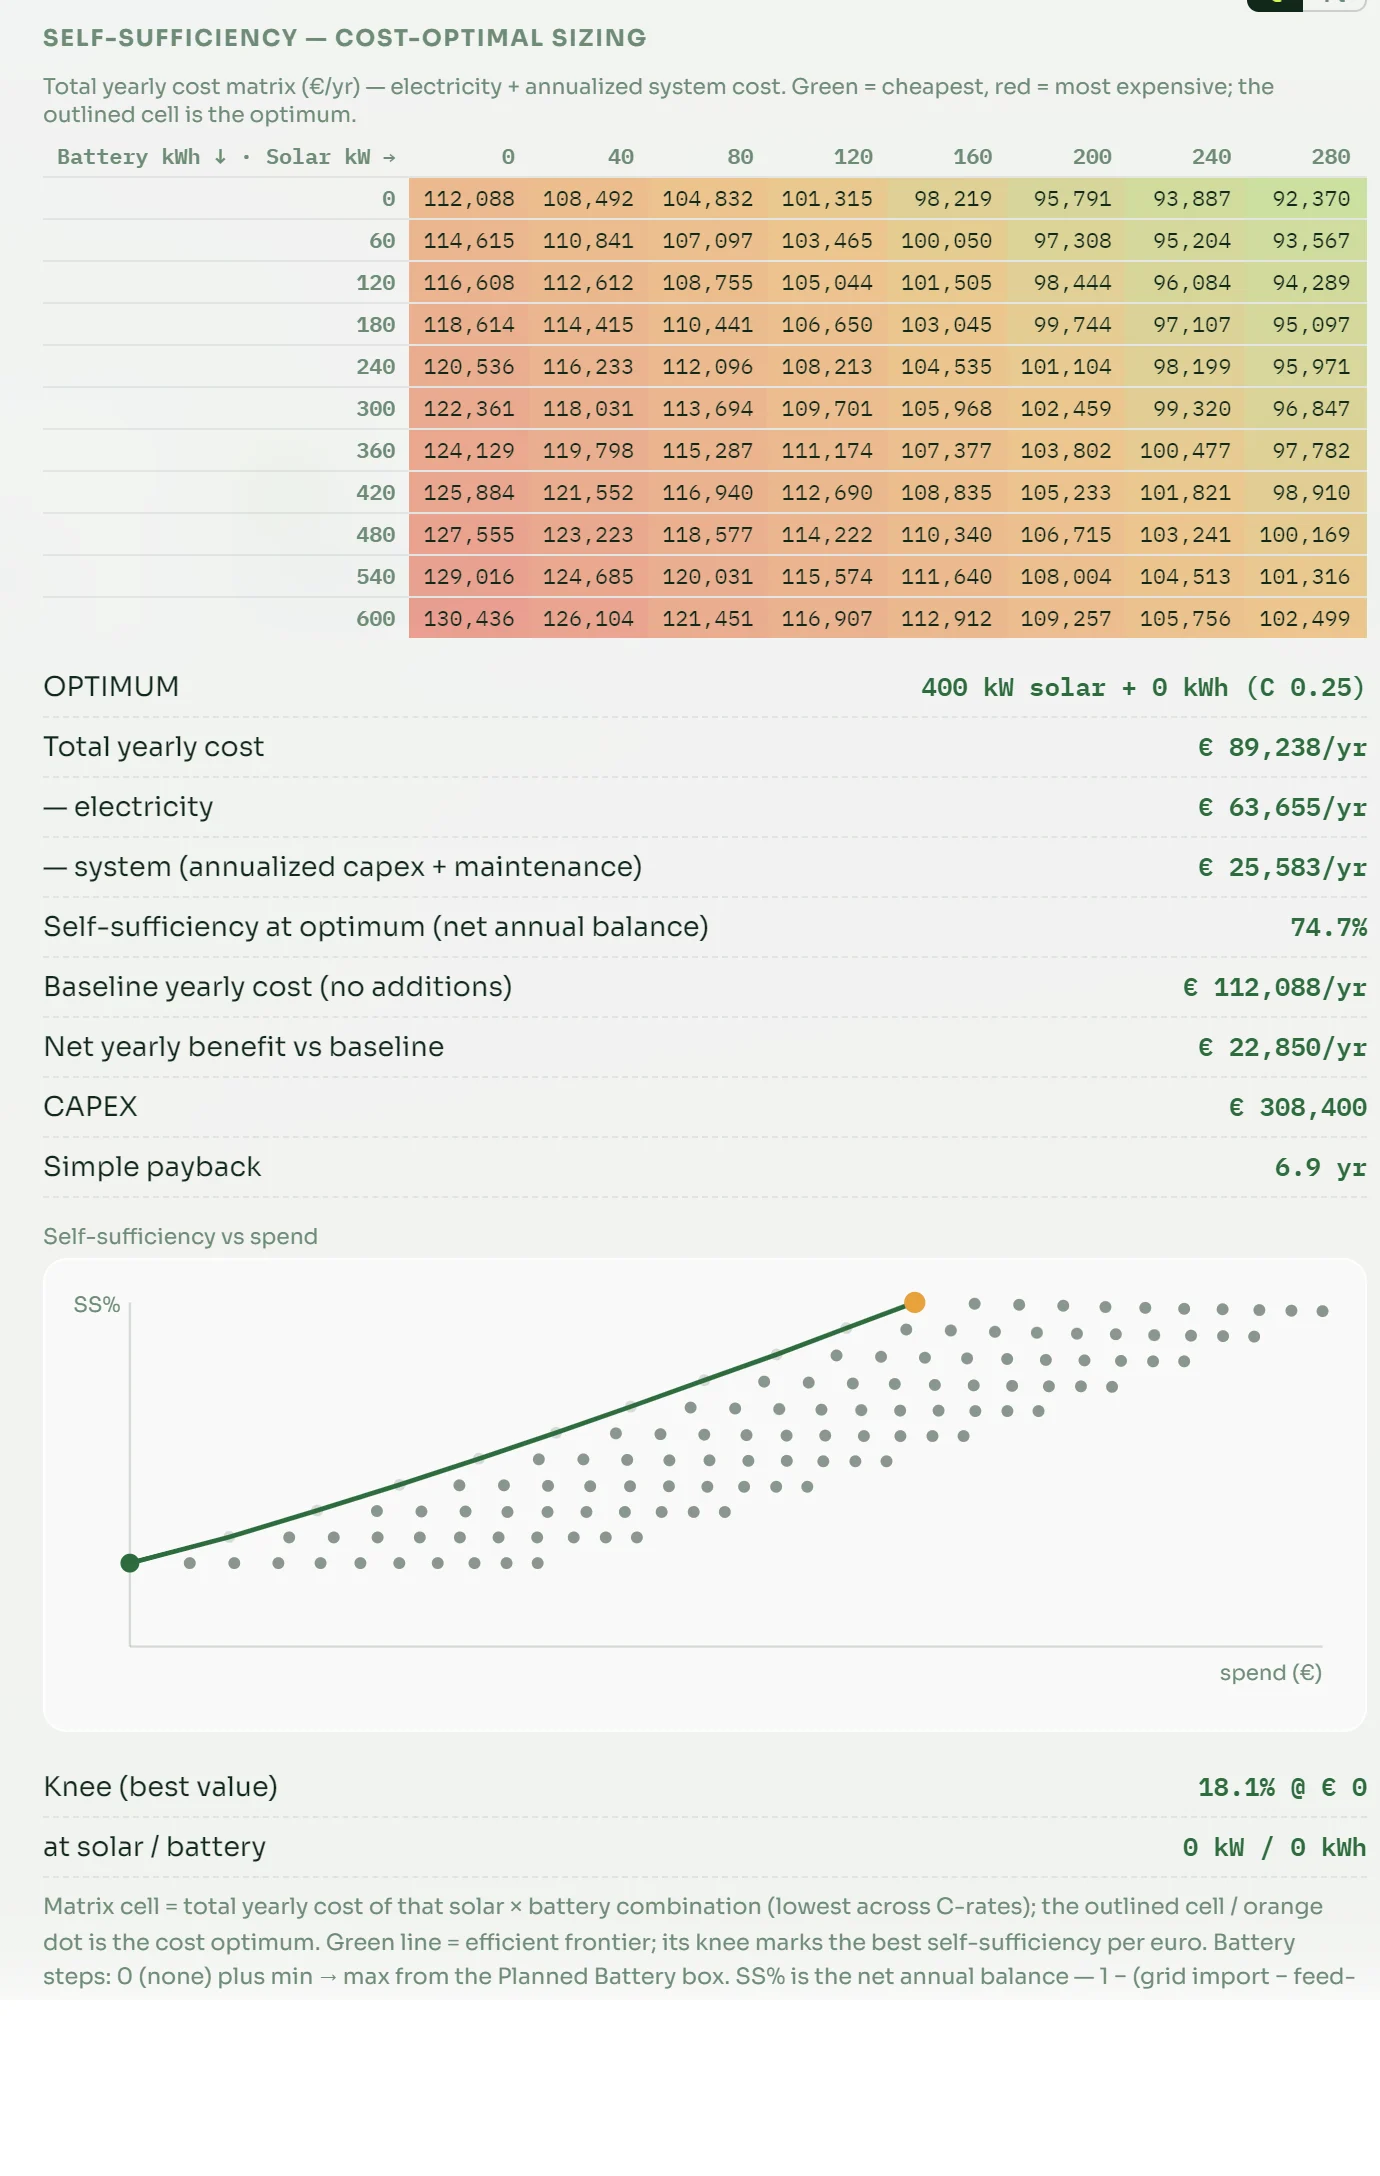
451 sizing combinations in one run. Optimum: 400 kWp of solar, 6.9-year payback, €22,850 saved per year.
5 · Reporting
What goes to the client and to the authority
Every report is built from the same calculation as the sizing — no manual transfer, so the two documents cannot diverge.
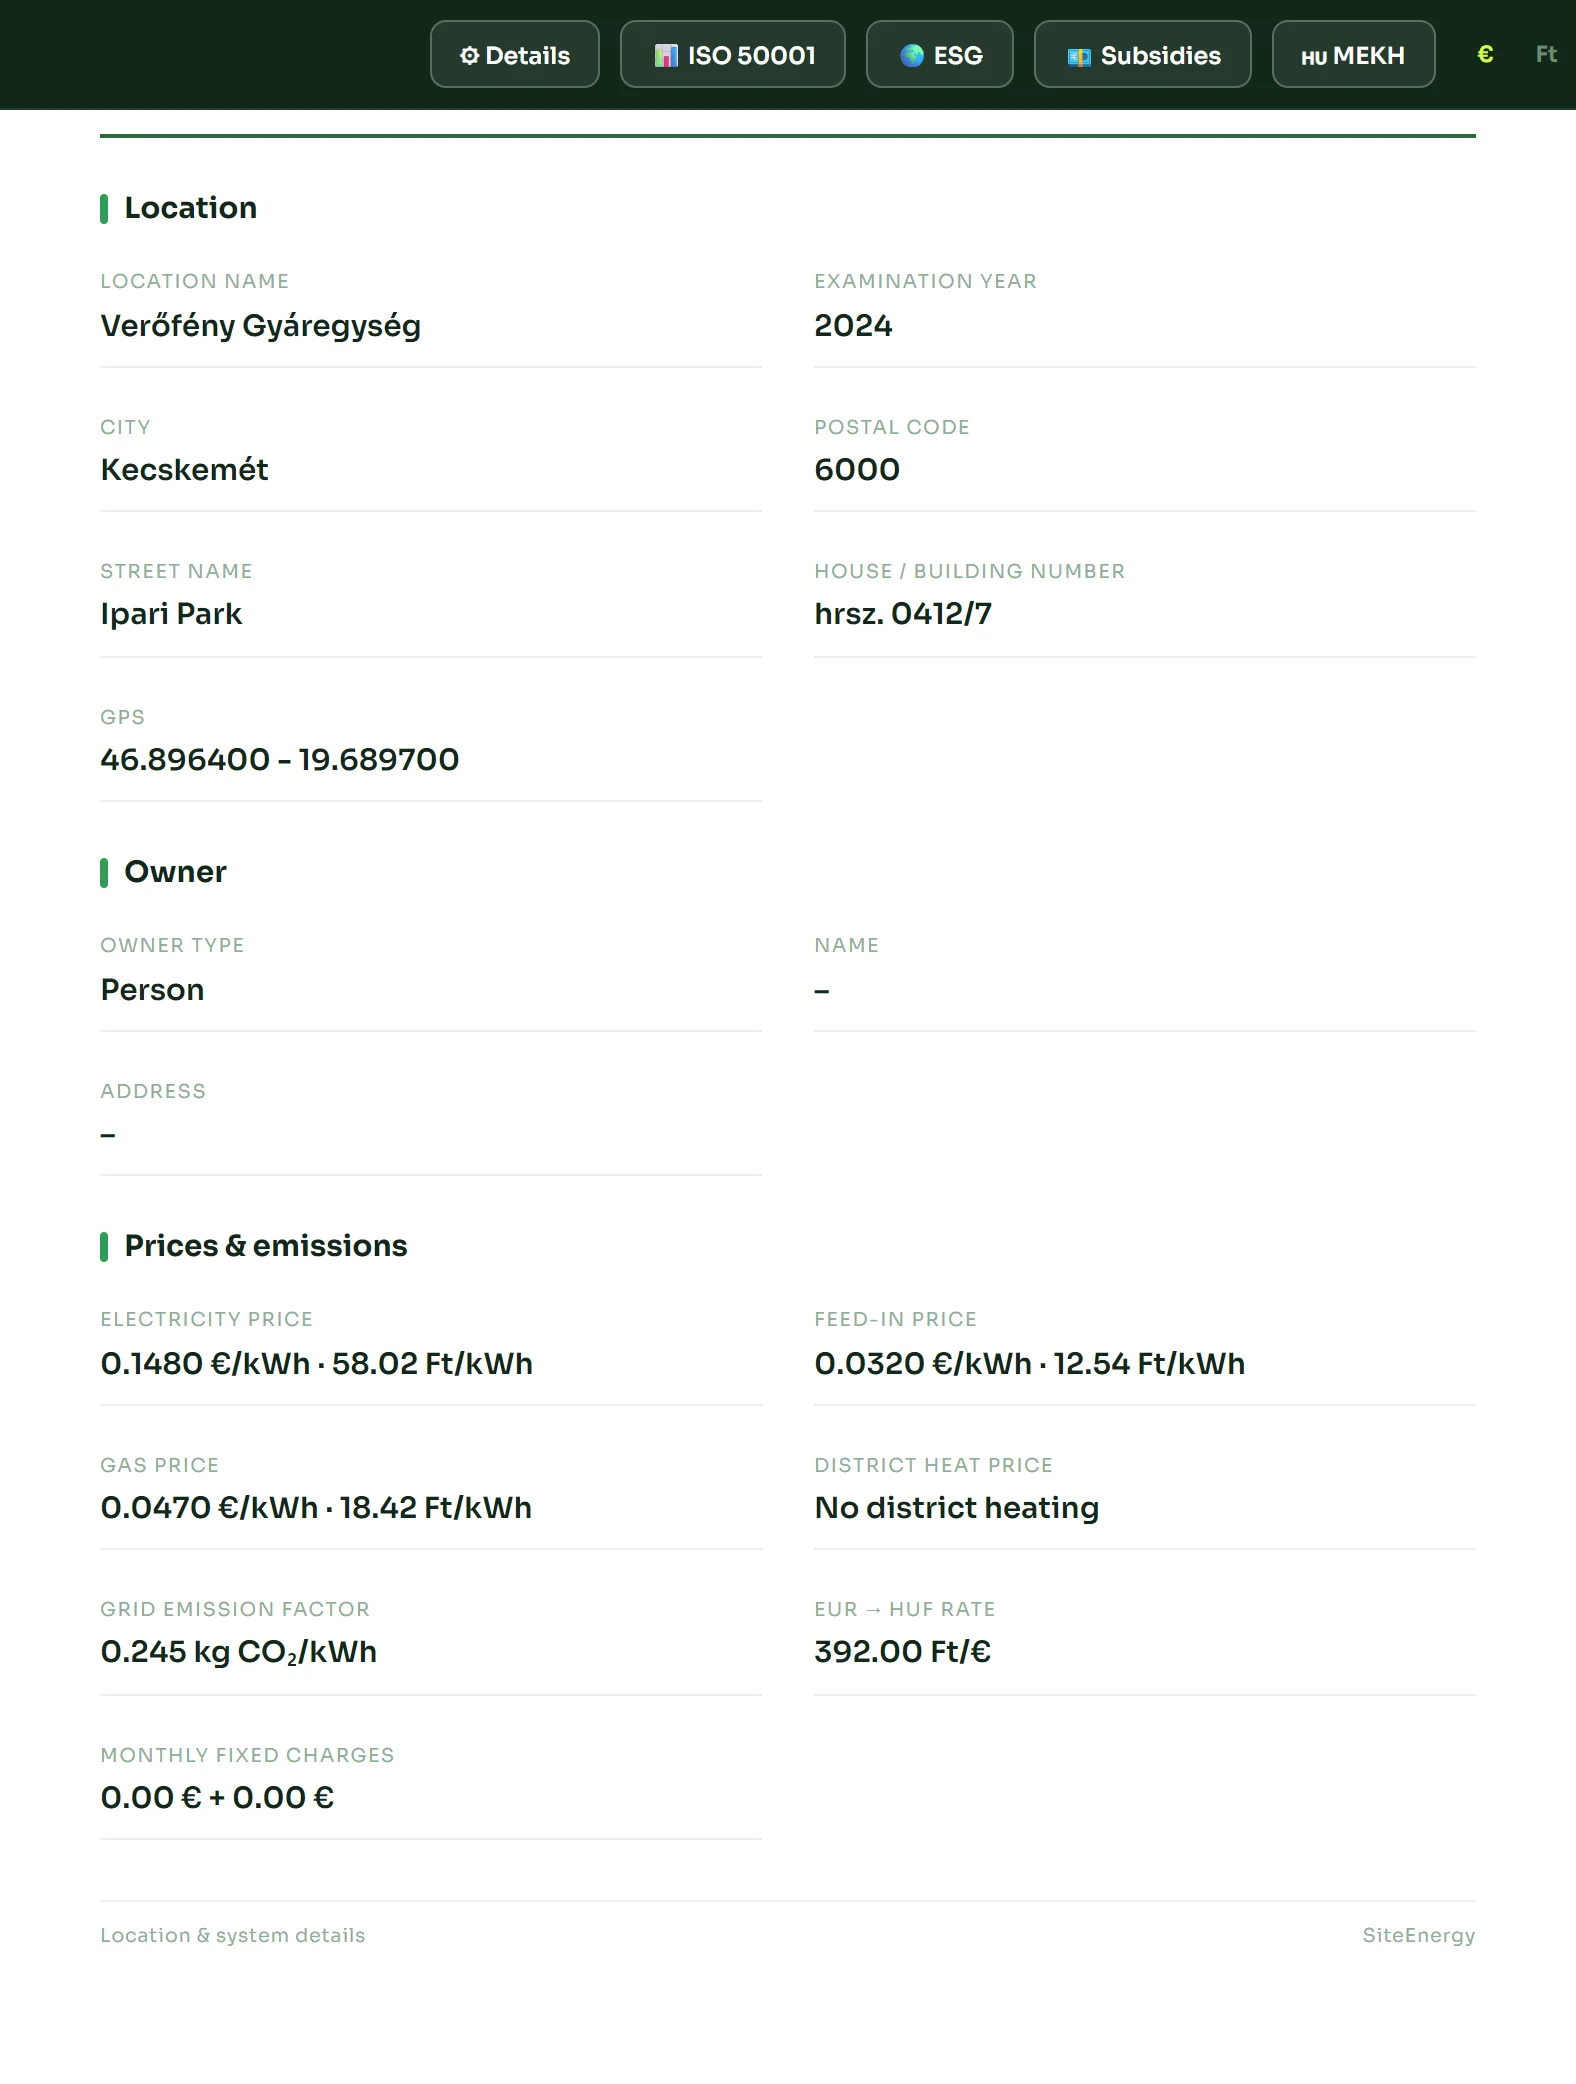
System analysis report
Executive summary, economics, sensitivity analysis, technology inventory and CO₂ balance. Printable and exportable as HTML, in Hungarian, English, German or Polish.
Hungarian regulatory report
The annual energy-officer report required by Government Decree 122/2015, with the full chapter structure: executive summary, annual energy balance by carrier, breakdown by area, specific indicators, measures, charts and methodology — plus a fill-in aid for the small-scale producer data sheet.
ESG and ISO 50001
Scope 1 (on-site fuel combustion) and Scope 2 (purchased electricity) accounting, energy performance indicators against a baseline year, with target tracking.
Energy communities
Links two or more sites hour by hour. Each hour the system matches surplus with deficit, and shares energy only where it benefits both parties — so the community never leaves anyone worse off. The grid-fee discount is a parameter, with presets for Hungarian and Austrian regulatory models.
Four languages, four national tariff sets
Hungarian, English, German and Polish interface — including the printable report. The tariff catalogue holds the structure of 30 electricity tariffs from Hungarian, Polish, Austrian and German suppliers, with time-of-use and spot pricing and per-country VAT. Hungarian prices are verified; prices for the other countries are reference values to be confirmed against the supplier's current price list — the app flags this in the UI.
See it on your own data
14-day free trial, with no payment obligation — choose the "Trial" plan on the order form.